Glimpse of Hoskote lake
What is a Wetland?
Wetland, as the name says the land that is wet.
So every land that is wet, is a wetland ? You may ask.
Well! not exactly. The land should have soil on it.
"I see, then can we consider the water that settles over a part of the soil on the side of the road that we see especially after a heavy downpour is a wetland?"
Umm... no, that does not count either because there is no vegetation in or around it.
You see, here is a way you can define a wetland. If the soil is covered with water either permanently or seasonally along with a vegetation and animal life in or around it. Technically those are the key factors that determine what you are seeing in front of you is a wetland or not. And if you observe closely towards its vegetation you can even determine the type of wetland. One more thing, along with vegetation the source of water also varies with each type of wetland. So clearly, from the above factors as you may have guessed that Antarctica is the only continent that does not have any wetland.
"The above definition stemmed a thought in me: can lakes be considered as wetlands?"
I am not 100% sure on this although many definitions overlap and incline towards telling me that a lake is a wetland. Personally, however, I do not think so. Because lakes do not have hydric soils beneath them or have vegetation through them. But, the areas surrounding lakes definitely qualify as wetlands because either marsh or swamps are usually seen on their shores. They have hydric soils and vegetation through them.
But, what is a Hydric soil?
Hydric, the name that originates from Hydro, indicates an environment which has abundant of water. When the water is ample within the soil, there is a lack of oxygen. This is called as a hydric soil. As a result, soil supports numerous plants and most importantly microbial life (which we will see later) are adapted to this type of phenomenon.
In this essay I explore different components attached to survival of the lake. This is one of the few places I used to visit often for photographing birds. The first time I had visited Hoskote lake was in 2016 and for the next three years my visit was mainly during winters. When I first visited this lake the view of the construction work was distant but concrete had crawled its way towards the lake gradually. Then there was a familiar sight everywhere, plastics and other garbage. I feel there is an urgent need to not only clear the garbage but also find a way to protect the boundaries of the lake.
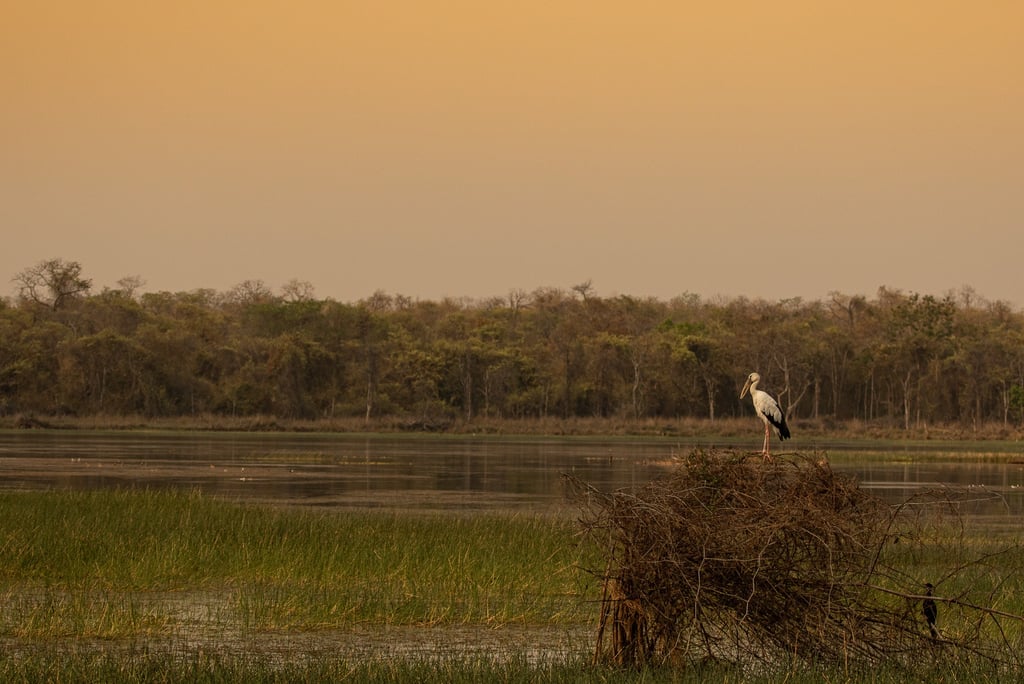
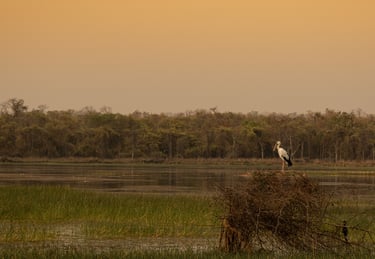
An Openbill Stork (Anastomus oscitans) against the backdrop of a marsh followed by a small forest patch. The marsh is home to many wetland birds, a little cormorant sitting below right of the stork.
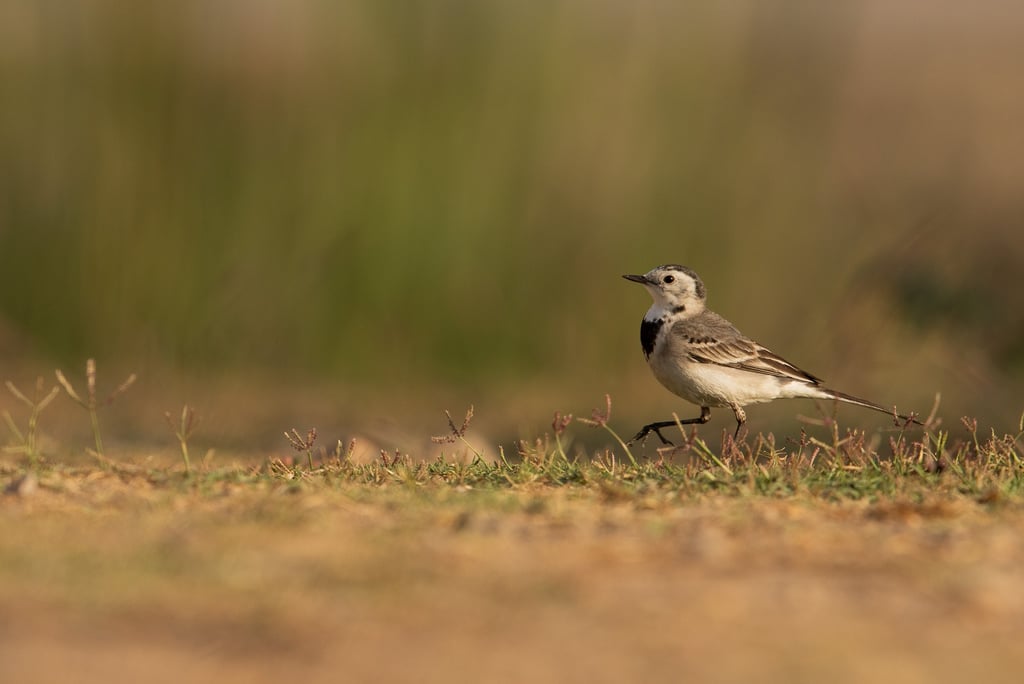
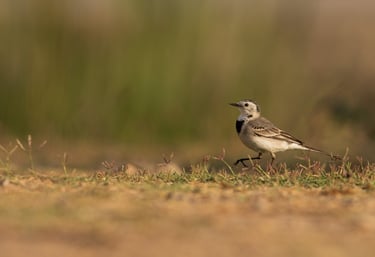
White wagtail (Motacilla alba) which specialists in wetland habitat migrates within India during winter.
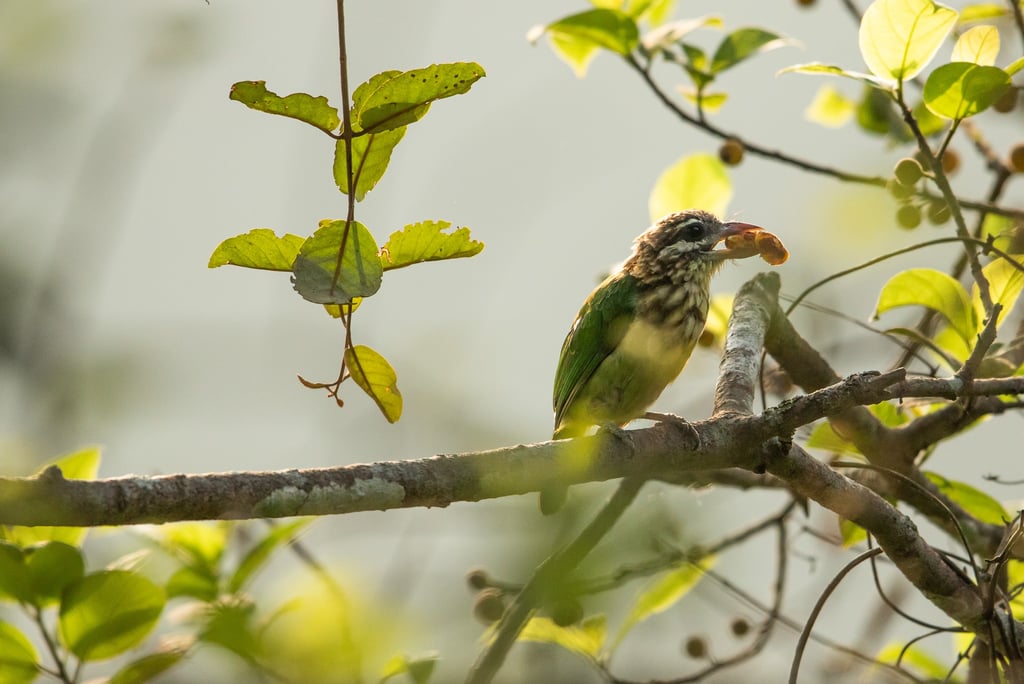
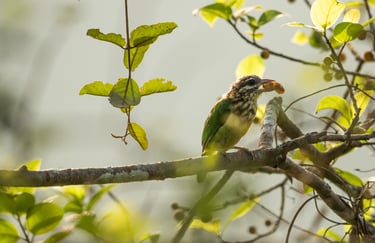
White-cheeked Barbet (Psilopogon viridis), an endemic to the Western Ghats is also seen around the Hosakote lake.
Data source and Acknowledgements:
The dataset (1990 to December, 2024) of birds was downloaded from eBird.
The code for the graphs plotted can be reviewed in the Github page .
GIS images were created from Google Earth Pro.
Soil Health information was captured from Perennial Earth. The satellite images represent the current health of the soil (June, 2025).
A big thanks to Canopy collective for providing the toolkit for conservation. It made connecting all components a bit easier for me.
What next?
I do certainly understand the economic benefits by building concretes and I also do understand that expenses poured in when disasters happen and other unfortunate events such as human deaths are pretty high. We have witnessed various situations like these in the past at various parts of the city when the lakes have been replaced by construction works, Bellandur and Varthur lake are prime examples and with latest one in 2025 at Manyata tech park. Wetlands are the primary habitats which gets affected when any city expands.
The lake is already filling with debris waste while the authorities say they will clear the garbage. To me that's the place to start in protecting the lake and its surrounding. Remove the garbage because who does not like to jog or run in a place which is clean. Who does not like to spend quality time at a place which is clean enough to play with their kids. This will also attract more people towards bird watching, as a result more records of birds and their behaviour will be registered.
Next step in protecting this lake is any further expansion of concrete should be put to a halt. A more sustainable ways shall be discussed or debated among everyone before raising residential areas instead of putting the weight of a bus stand, a theme park or another gated community on her heart. Karnataka government recognises this lake under the category of Natural/Scenic beauty. It does also provides a gateway to become one of the wetland cities in Ramsar convention. It is not scenic when the next generation of people walk amidst sky scrappers. Saving lakes like these not only helps biodiversity but also to humans as well. Think of this, from where do you get the oxygen you breathe?
The narrative on the soil health is based mostly on the colour coded regions that are favourable for birds, bees, microbes and soil in general. But we had also seen certain patches do not have colour coded, which means they are either covered with water or concrete.
Presence of water is a good sign but concrete is not. It gives an impression to many birds that the lake is not the right place as of now for raising their young ones. An increase in cement, steel and paint not only indicates there is a decrease in the vegetation but it also means the probability of an increase in the temperature of air in this area is high. There are potential side effects such as when there is an increase in the air temperature around wetland area, the major consequence is that the water body will absorb more heat and will evaporate more than what it normally does. Which is not good.
With the rise in the heat, people working in the hot sun around that area may die due to heat related cardiovascular diseases. There is one more aspect which will cause problem with this phenomena, which is the possibility of Heat Shock Proteins (HSPs) getting affected because of this increase in the temperature. I could not find any study as such which directly links affecting HSPs due to the heat generated in the Urban Heat Island, a phenomenon where an area in the urban experiences warmer than its rural parts. Now, Hosakote lake is in the rural side of Bengaluru hence the affects may not be visible as of now but if the concrete continues to occupy more space especially towards the lake then there is definitely a reason to concern. Starting with an unsettling sight of decrease in the number of birds that migrate and also the ones who stay long term will face shortage in the food, a severe shortage of a place to take shelter, breed and raise young ones, there will be shortage of fish in the lake which are also a bread winner for the local fishermen. I am assuming there could be other side effects that may arise. A person who chose to walk or jog at the edge of the lake many years ago might have heard sounds from more number of birds. Would have experienced fresh air. Today, the person may have observed the orchestra from birds had reduced and sound of fast moving had increased.
But, why do birds migrate ?
Mainly for breeding, feeding and raising their young ones of course. They travel from different parts of the earth and some within the country, especially during the winter and few in the summer and monsoon in search of better conditions that will suite them to do those activities.
Every family of birds need are different. While the ones flew with larger flock require shelter which is spacious, others are extremely satisfied with significantly small space. Some like to have good number of trees around them, some primarily prefer the ground to forage where there are almost no trees and have fun. These are common criteria for species which travel occasionally or the ones reside here for longer duration.
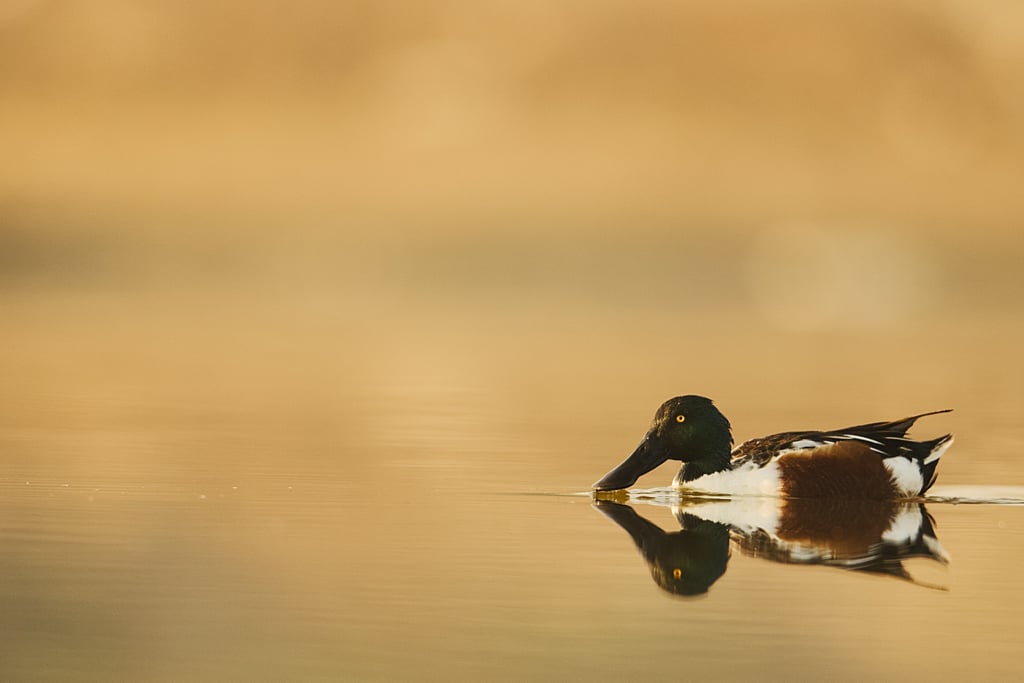
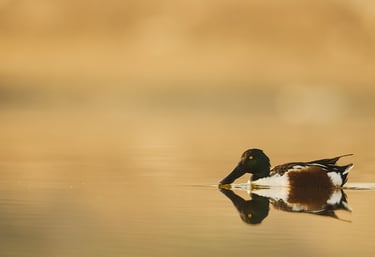
Northern Shoveler (Spatula clypeata), one of the migratory birds that often visits in the lake during winters.
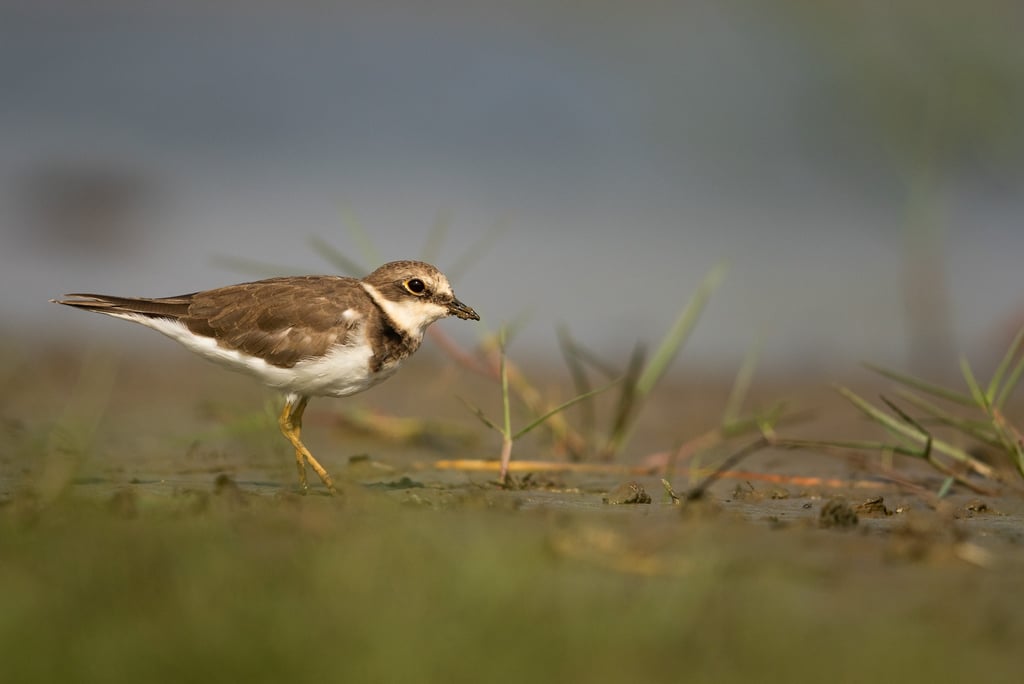
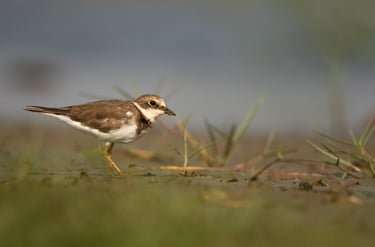
Another visitor, Little Ringed Plover (Charadrius dubius), which migrates within India and few come from outside to winter in the sub continent.
Image taken from Google Earth Pro represents the scenario of Hoskote lake and its surroundings in 1985.
Image taken from Google Earth Pro represents the scenario of Hoskote lake and its surroundings in 2014.
Image taken from Google Earth Pro represents the scenario of Hoskote lake and its surroundings in 2019.
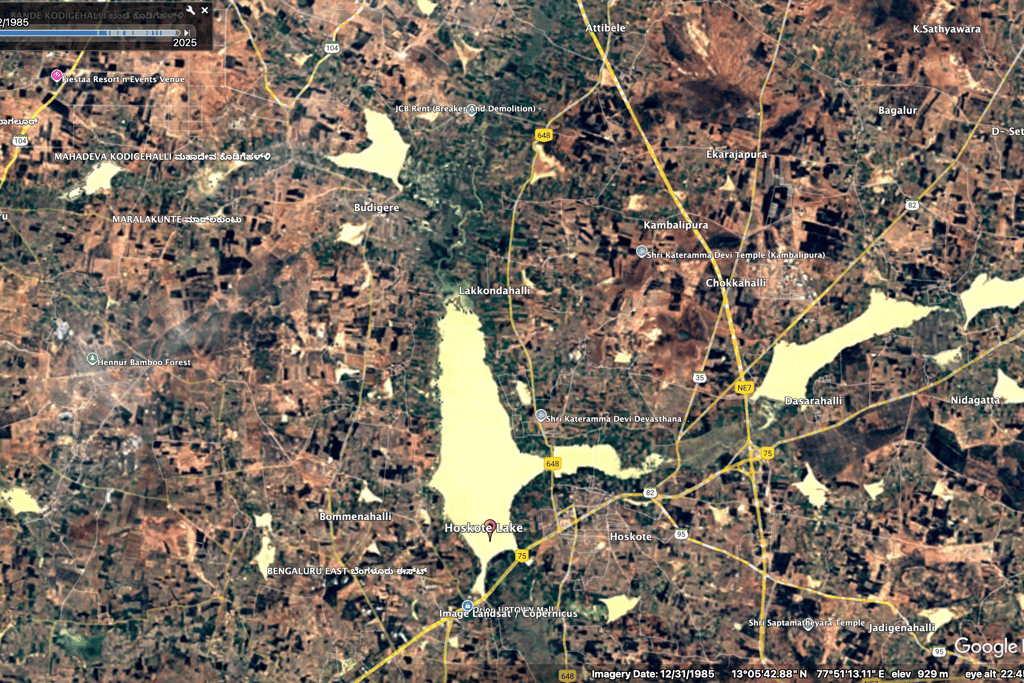
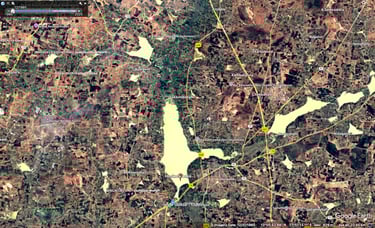
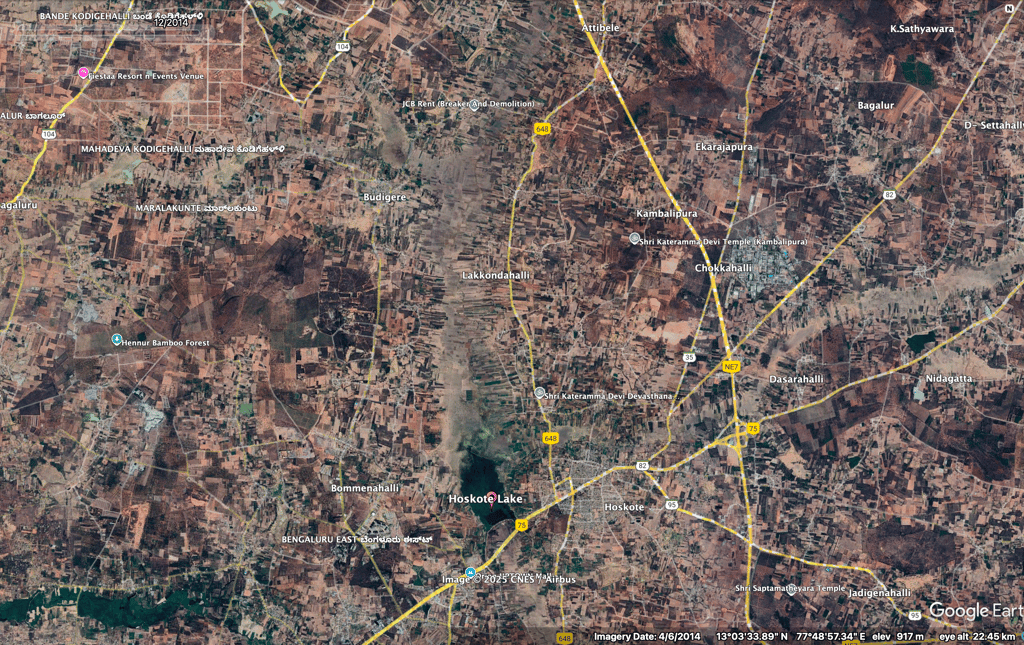
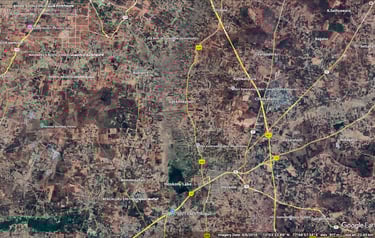
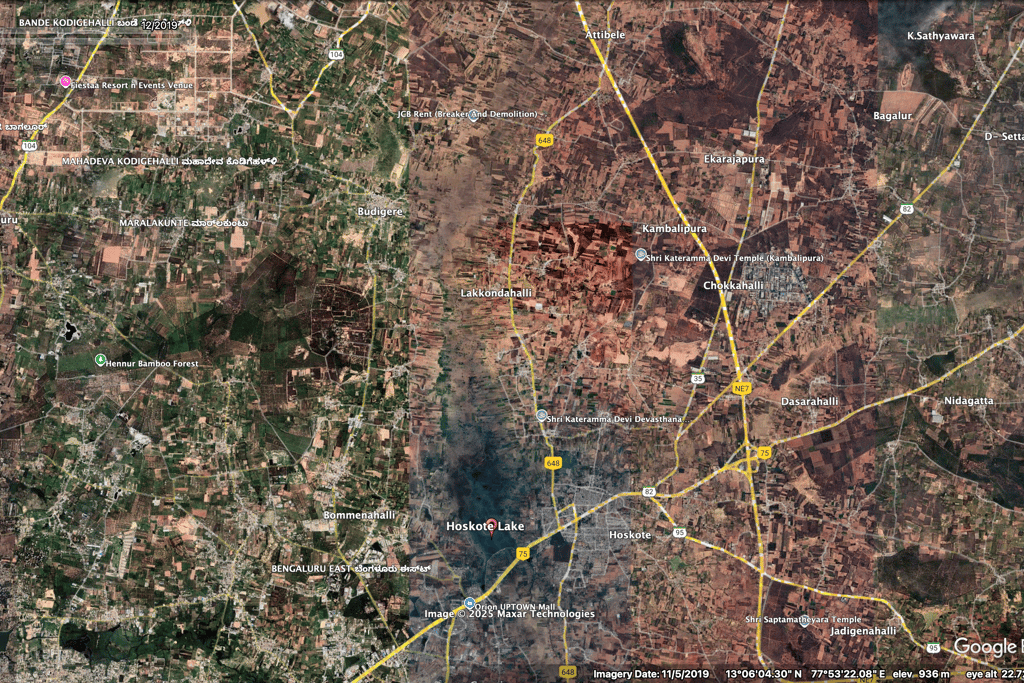
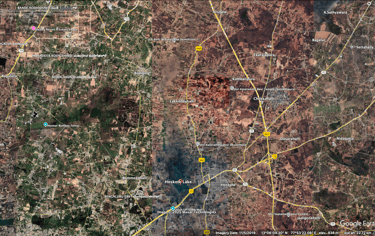
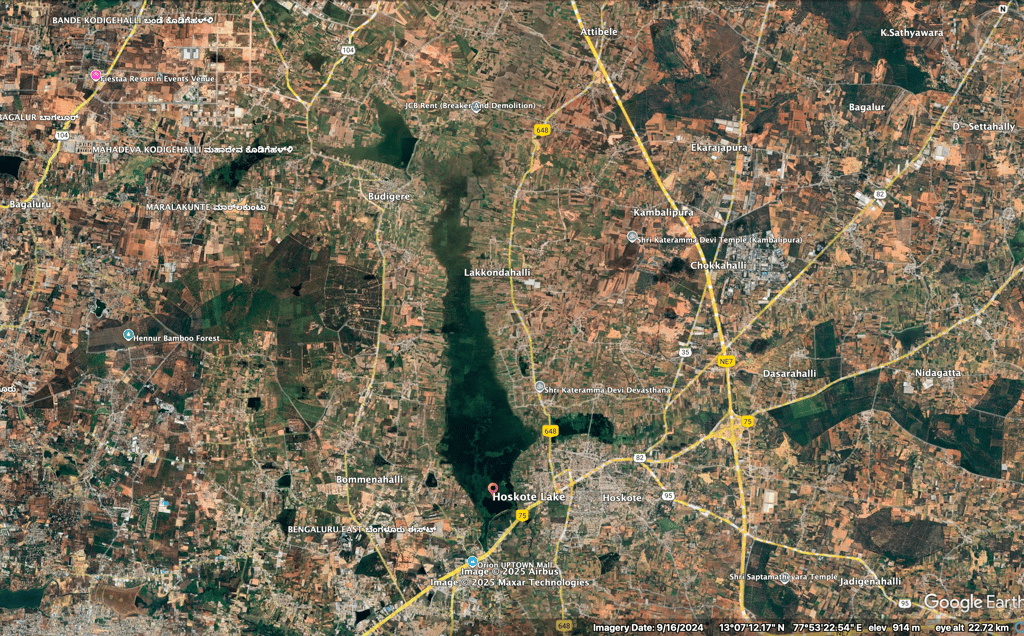
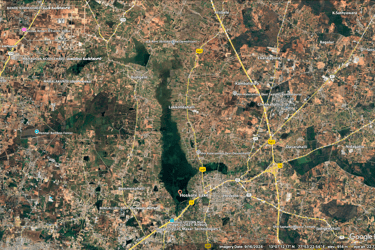
Image taken from Google Earth Pro represents the scenario of Hoskote lake and its surroundings in 2024.
Albeit I could not get images of exact dates of the year, but it does not take away the fact that much of the vegetation has been lost in the four decades. It is visible. But it also made me realise that there is still so much room for birds to thrive here.
Trends of birds population
And because the health of the soil and vegetation looks ok around the lake it is normal to witness insects such as caterpillar feeding on the leaves, ants and other insects wandering on the ground. And to feed on these insects it is common to witness various insectivorous birds around (along with lizards and spiders) them.
When I look closely on the collected data, most insectivorous are on the decline including the state bird of Karnataka, Indian Roller, had diminished almost half the number that were flying around this lake in 2019. Another species which was witnessed to be down by half the number is Clamorous Reed Warbler. Warblers collectively reduced 15%. And nearly a third of larks were shrunk.
Of course, the scene is certainly not extremely gloomy. There are diverse family of birds which are slowly creeping in or at least stable such as the favorite bird of many, Indian Grey Hornbill, then Owls, Bulbuls, Darters, lapwings, pigeons etc. Among these few of them are represented in the below graph
There is no straightforward way to accurately point to conclusion on why there is an increase or decrease in population of species. It could be availability or disappearance of food and breeding sites. There are births and deaths of birds. Some may not have migrated to this part of the geographical area or few might have chosen to stay because incentives in other areas are further degraded are just few of the various reasons. I can interpret certain aspects regarding the dip from 2020-22 for many species is due to records of these birds might not have taken due covid-19 pandemic. Any other reason for the dip in numbers of certain species that I can imagine may not come close to the truth such as those birds could be more shy than others and prefer not to be disturbed (such as Bluethroat). As a result, rather than foraging in the open they might have move to a secluded place and we could not make a record of theirs. Or perhaps there isn't much place left for them over here to eat or breed and could have been migrated else where. If that is the case, then it would be interesting to see where else they had decided to make their home.
Space is a vital aspect for breeding, which as we know is an important activity for every species. Different kinds of birds prefer building nests at different places. Family of birds such as Podicipedidae (Grebes) prefer nesting on the vegetation, the nest of the Chloropseidae (leaf birds) are at the crown of the tree, Pelecanidae (Pelicans) usually nest in colonies and twigs are placed on a low tree. They build alongside of other waterbirds like Painted Storks. Ground birds such as Turnicidae (buttonquail) place their nests on the ground.
Once this is taken care of then they also need enough food to raise their young ones. Many of these birds are omnivorous so they not only depend on plants and trees for fruits, seeds and nectar from flowers but also on fish, insects and other invertebrates as well. While raptors find rodents and other small animals fascinating to them, for most birds its those small invertebrates such as caterpillars, ants, flies etc are flavourful. And some of these invertebrates, for instance, aphids, caterpillars, beetles, whiteflies, thrips, and weevils also depend on plants. Well for the same reason as many species, food and reproduction.
A caterpillar is attracted to leaves, flowers, fruits so on... and for shelter there is no better place for them than plants. Likewise, Beetles lay eggs inside the tissue of the plants and the young ones can access the food directly.
The role of Microorganisms
The interactions among various species within Animalia are much broader, deeper and incredibly complex. Starting with plants, as we know, use sunlight and other sources to grow themselves. We also know that majority of the birds feed on both plants and insects as well. Raptors feed on birds, insects and small animals. Dead birds (and other animals) on the ground are served as a source of food for the micro organisms, who then break down this food into nutrients and store in the soil which is useful for the plants to grow and this acts as a food for insects. The cycle continuous. This is a classic Food Web. It is often the species which are visible to the human eye are highlighted or more talked about. They are indeed important. I feel it also important to discuss about the ones which are invisible to the human eye. Enter the world of microorganisms. To me they are the protagonists in this story. They are the invisible force who are supremely responsible in the way ecosystems flourish.
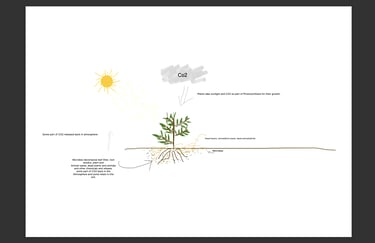
The role of microbes is more than sending the nutrients back to the plants. They play an extremely key part in storing the carbon content in the soil. The best way to explain this phenomenon is starting again with a familiar concept, Photosynthesis.
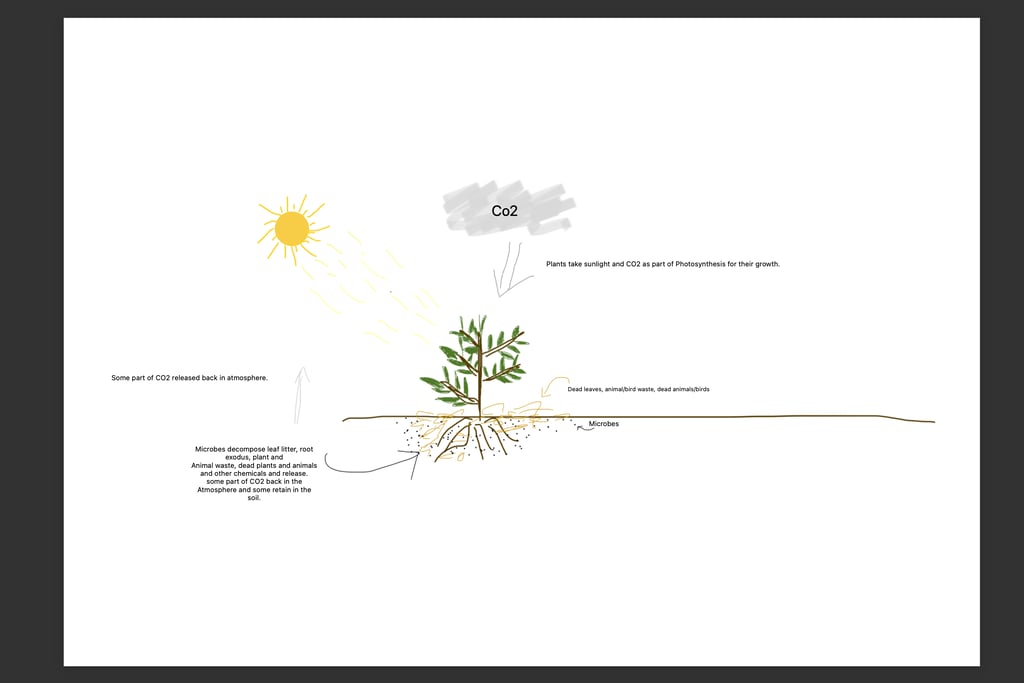
During this process, as we know, plants capture Carbon Dioxide (CO2), along with sunlight, from the atmosphere. From the captured air they strip away the carbon atoms for the growth of their roots, stems, leaves and other parts. So right now the carbon residing inside plants is in the form of solids. This solid form goes inside birds, animals, insects and any other species when they consume plants. After these species die, along with them the fallen leaves, dead parts of plants such as bark, twigs that fall on the soil, carry huge amounts of carbon and essential nutrients such as Nitrogen, Phosphorous and Sulphur within them. These are a bliss to microbes such as Bacteria or Fungi as they are source of food to them. When these microbes decompose this substance then certain amount of carbon reconnects with Oxygen and goes back into the atmosphere again as CO2 and large amount of carbon stays inside the soil. Overtime this becomes a massive sink of carbon. So think microbes as gatekeepers which decide how much carbon dioxide to transform into biomass and how much to release back to atmosphere.
But then these small water bodies became victim one after another. They took the heavy weight of bricks and steel on them year after year. Slowly and perhaps methodically they were made to disappear as if they never existed. There is no description required, each image tells the story.
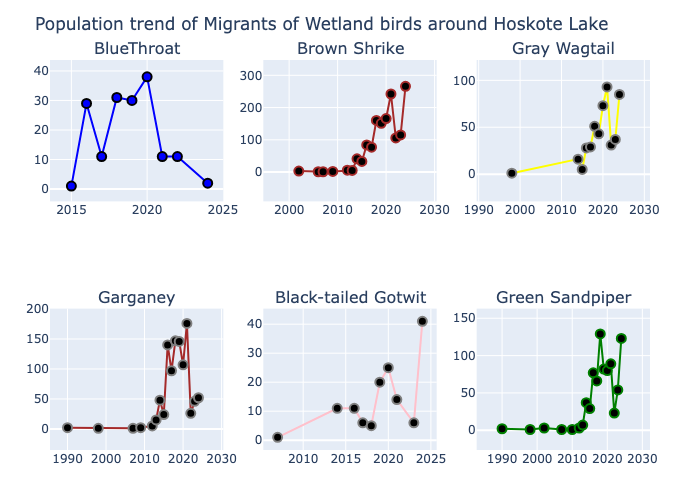
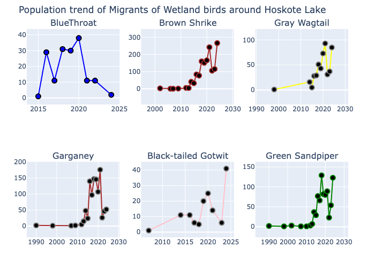
Above graph describes trend of some of the migratory birds found at the lake from various periods. On the x-axis, you can see the years and on the y-axis, the number represents the count of the birds during this period.
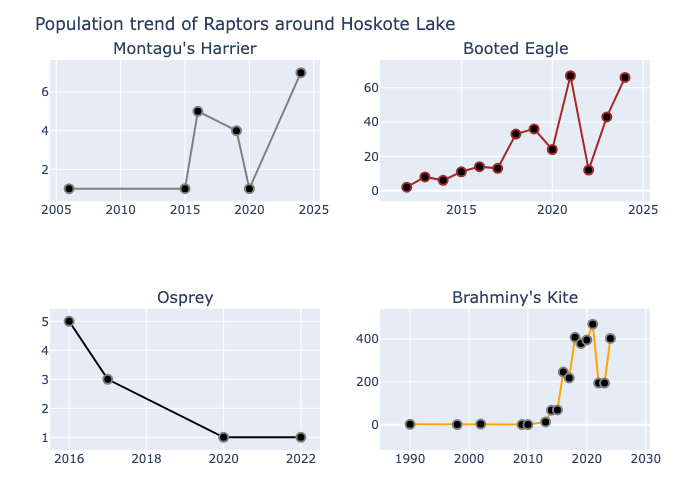
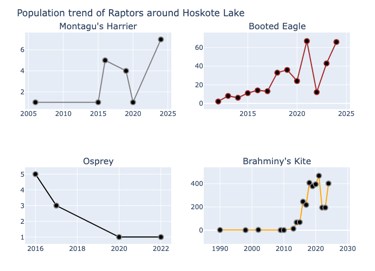
Above graph describes trend of raptors found in the lake from various periods. On the x-axis, you can see the years and on the y-axis, the number represents the count of the birds during this period.
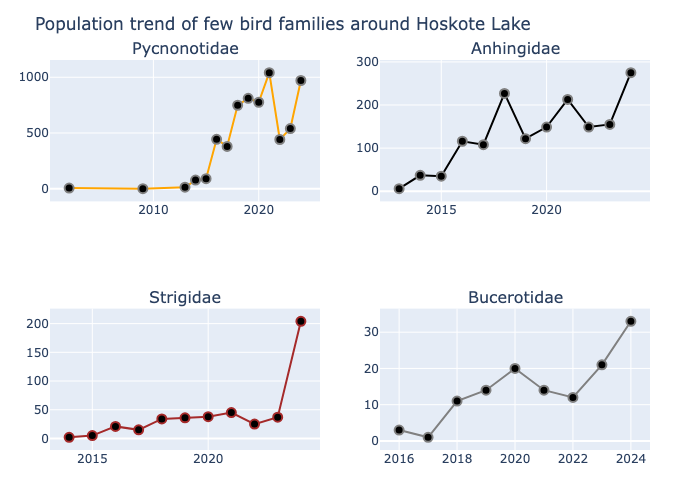
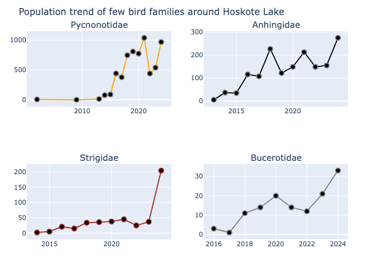
Above graph describes trend of four families of birds found in the lake from various periods. The families in the top row are Bulbuls and Darters. In the second row families represent are Owls and Hornbills. On the x-axis, you can see the years and on the y-axis, the number represents the count of the birds during this period.
Think of the other way. If microorganisms were not present or weak enough to store nutrients in the soil, then plants would have struggled to grow. Thus insects would find difficult to get food for themselves. As a result, many insectivorous birds might have to find another place in search of food and raising their young ones. And raptors will follow too. This kicks off the degradation of the health of the wetland.
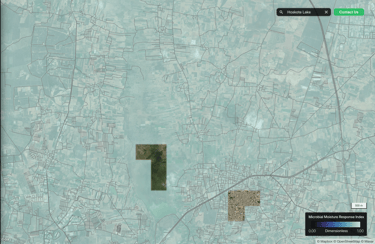
In the context of the Hosakote lake we shall see what the results of the above metrics convey. As you observe the image, pay attention to the scale on the right bottom of every image. This indeed tells the story,
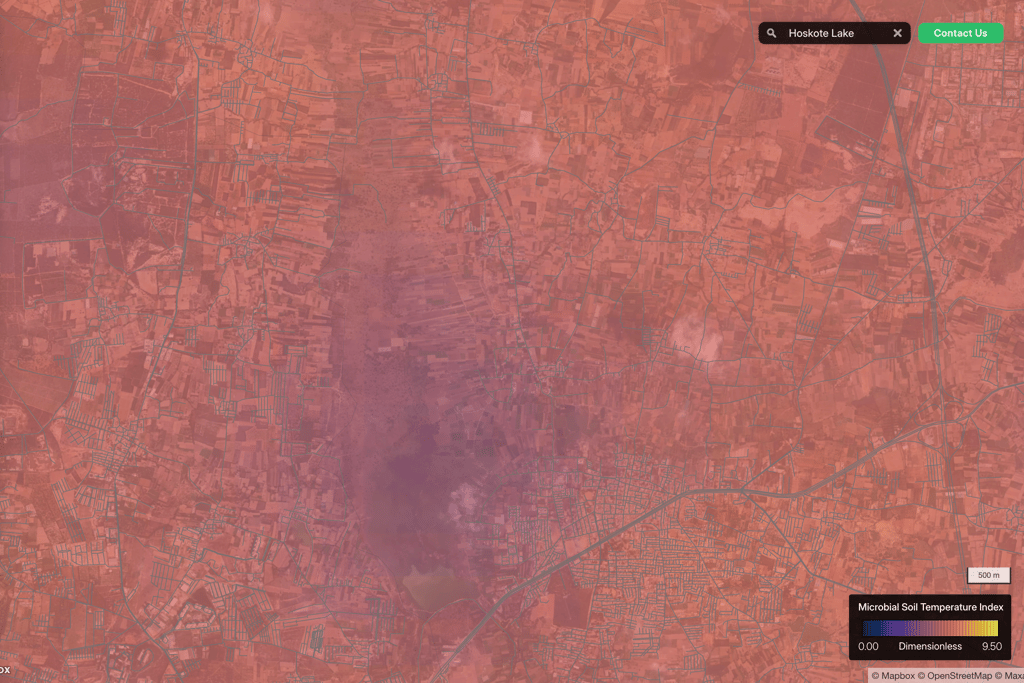
The only index among others whose values that are favourable to microbes fall on the left side of the scale. The Microbial Soil Temperature Index tells how temperature affects microbial activity. In this case the image has purple shades on the north of the lake and extends further north which according to the scale is relatively lower temperature (compared to the right) and is suitable for microbes to their job.
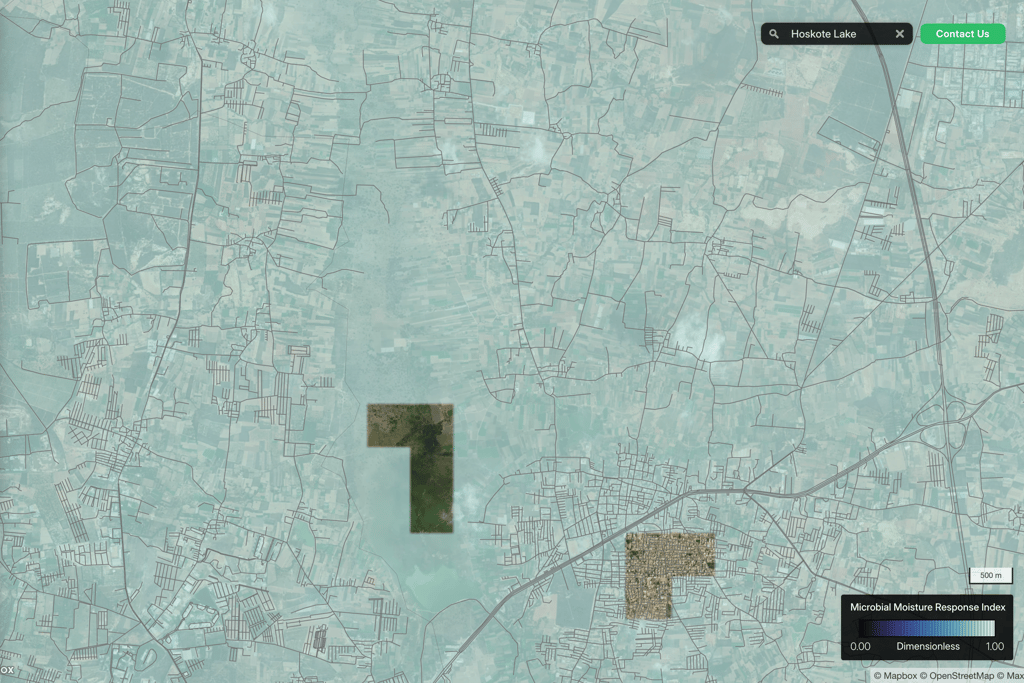
Perhaps this is the most important images related to metrics of the soil health: Microbial Moisture Response Index. It indicates how well microbes are responding to the given moisture conditions in the region. In this case not only on the north of the lake but the pale blue colour is spread uniformly to further north.
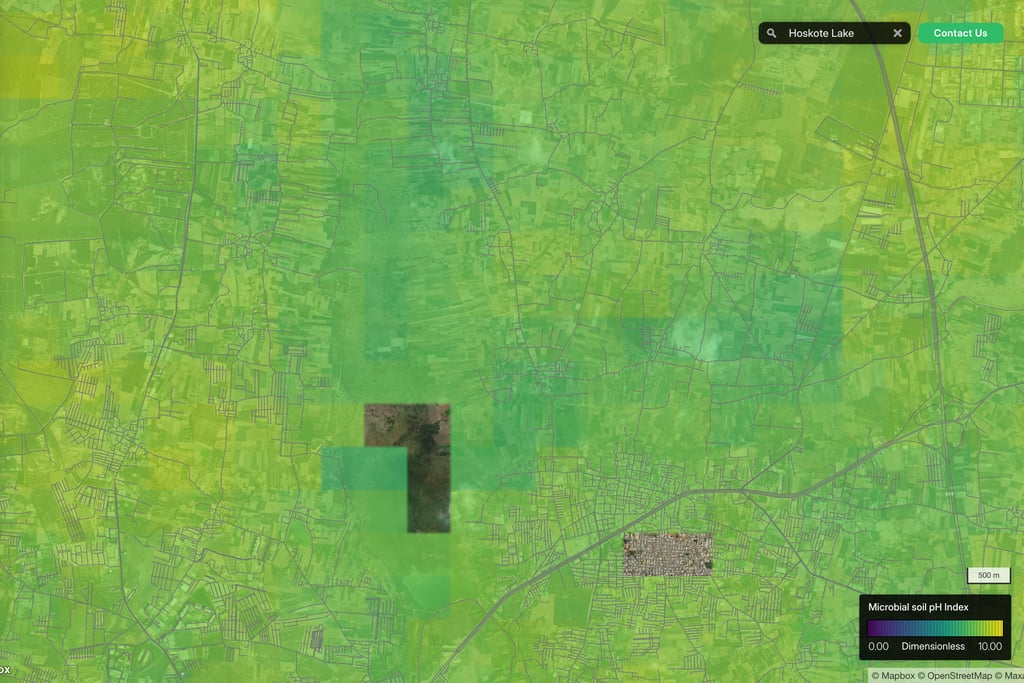
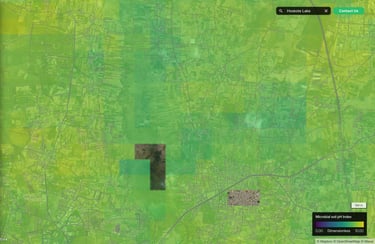
The alkalinity of the soil is measured by Microbial soil pH Index. The north of the lake as more lighter green shades, which as per the scale is more favourable for microbes.
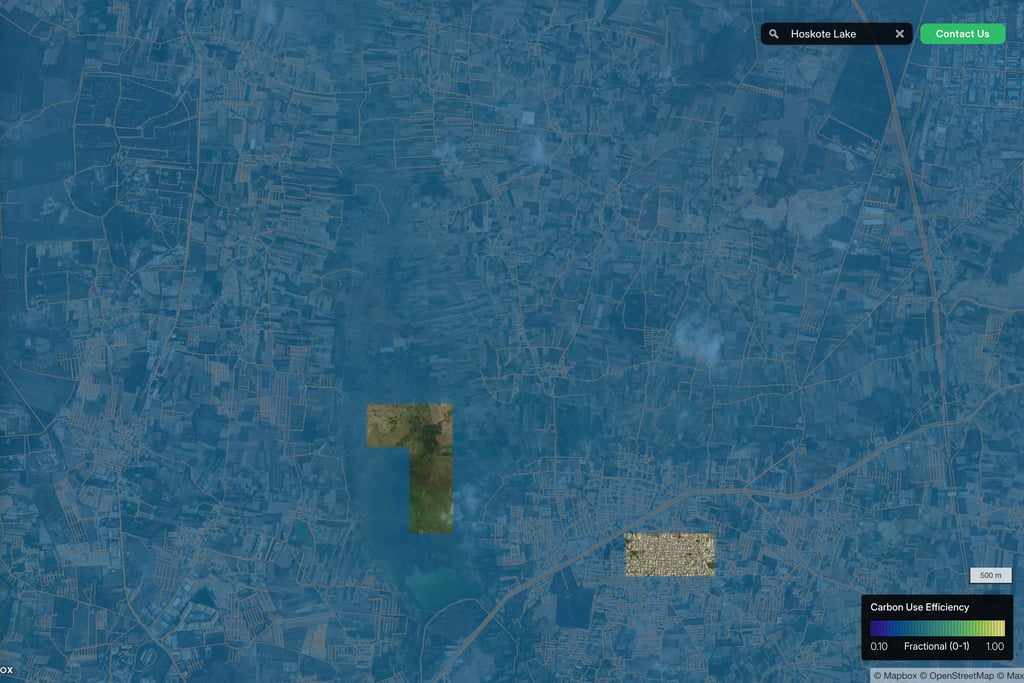
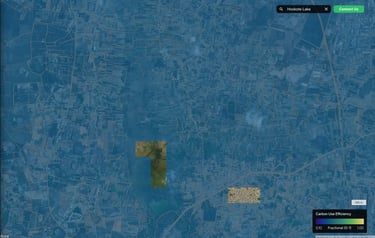
Carbon Use Efficiency tells how efficiently microbes transform the soil carbon into organic biomass. You see bluish-green colours right on the north of the lake (same patch as we had focussed in previous images) which falls from middle to few bars on the right of the scale.
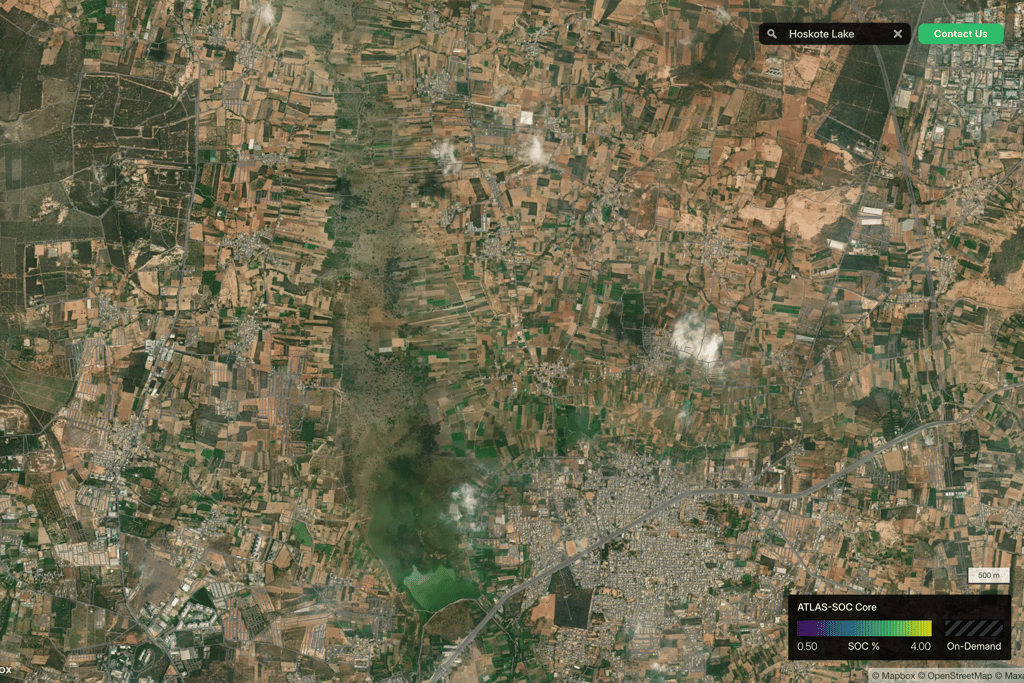
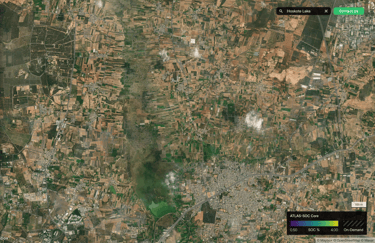
Atlas SOC (Soil Organic Carbon) represents the amount of carbon stored in the soil at a given area. The measurement as displayed in the scale is in SOC %. In the image the green colour that you see around the core part of the lake is the area which stores maximum amount of soil carbon, approximately around 2-2.5% as per the scale.
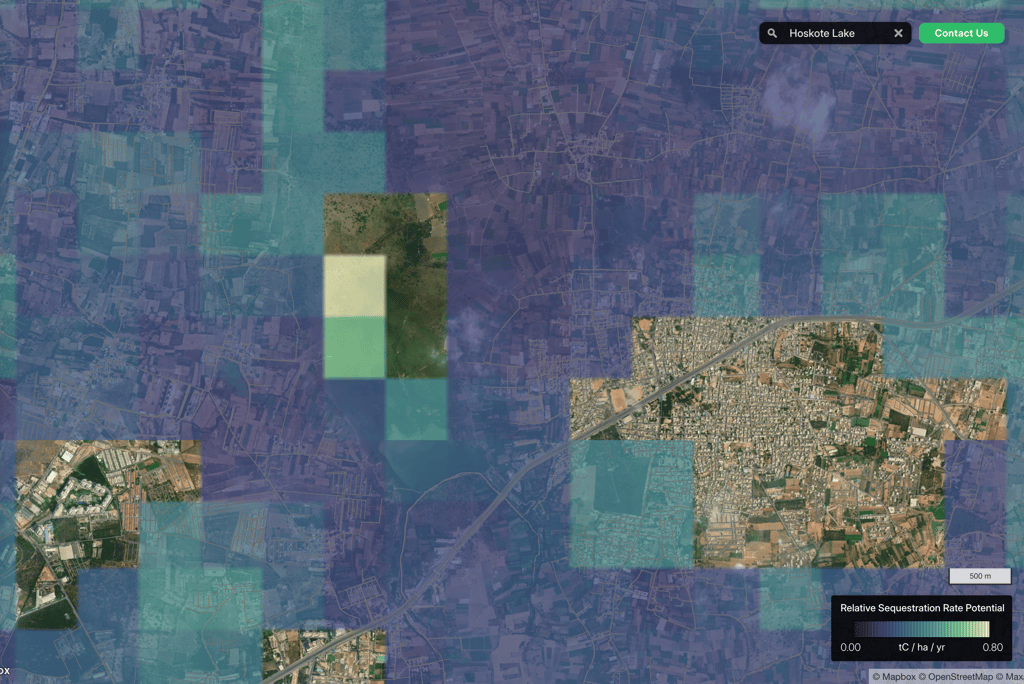

While Atlas SOC tells us the amount of carbon stored in the soil at a specific place, the speed at which this carbon is absorbed and has a potential to store over years is determined by Relative Sequestration Rate Potential . It is measured in tonnes of Carbon per hectare per year. By looking at the image we can see colours coded in gradients of green and purple. There are patches where there is no colour on the right and left, I assume based on what I am seeing is that there is only concrete and no soil that absorbs carbon. And the one in the center is perhaps covered with water.
Back to focussing on the green colours in the image, especially towards the north of the lake where the colour turns more lighter has the potential of storing carbon relatively faster than other regions. As per the scale it is measured up to 0.8 tonnes of Carbon per hectare per year. Although this region might not be in hectares but it gives us information that its storage rate is higher than its surroundings.
State of the Vegetation
I felt optimistic as results from above images do not put the needle on the negative side. And if the health of the soil is good then I assume there has to be room for the growth of enough vegetation for birds to breed.
To know about this, I started to look at the map which showed the conditions of vegetation in 2024 and I was not surprised seeing copious amount of concrete surrounding the lake. Those tall towers may look like they are guarding the lake but its the other way around actually. Moved the range slider in the Google Earth Pro to 2014, 2004 and 1985. Now I am completely beaten. There are (or were) many water bodies visible in all directions in 1985.
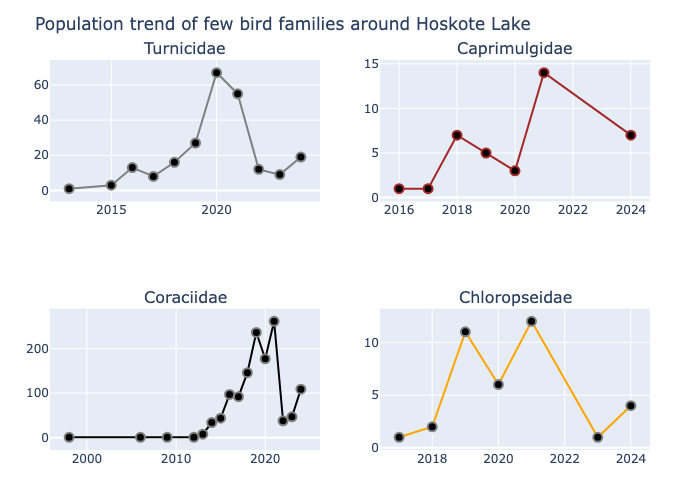
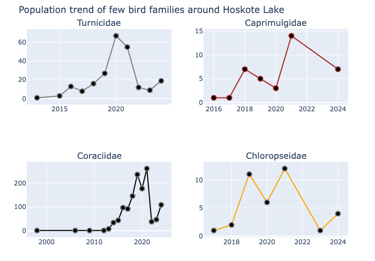
Above graph describes trend of Insectivorous found in the lake from various periods. The families in the top row are Button quails, Nightjars and in the second families are Rollers and Leaf birds. On the x-axis, you can see the years and on the y-axis, the number represents the count of the birds during this period.
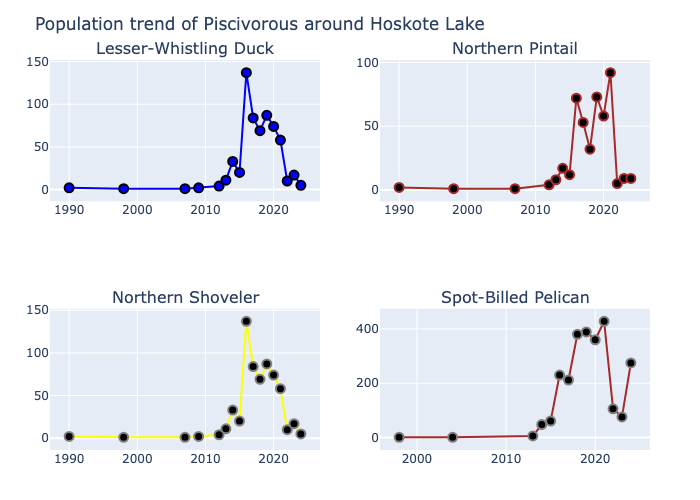
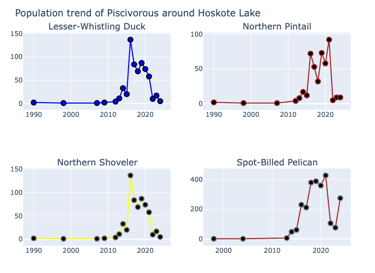
The story is no different for birds that prefer fish as their primary diet, the Piscivorous. Families such as Pelicans and Anatidae (ducks), as I observed were lessened by a third and half of Podicipedidae (Grebes) disappeared. It is obvious that when the prey reduces in number, predator has almost no business to stay there. Falcons were reduced by half. The lake welcomes numerous guests during winter every year perhaps since its inception. And they have chosen to turn down this lake since few years and now their numbers were alarming especially from the Anatidae family (ducks, geese etc) , where species like Garganey, Northern Pintail, Northern Shoveler have disappeared by more than a half.
While the data was consistent for most species since 2017, it is from 2019 there was a steep decline in the count of many species mainly insectivorous.
Above graph describes trend of piscivorous found in the lake from various periods. On the x-axis, you can see the years and on the y-axis, the number represents the count of the birds during this period.
About Hoskote Lake
The marsh ecosystem has one of the complex web of relationships among flora, fauna and microbes. This interconnectedness is essential for the system to survive and function. The marsh surrounding the Hosakote lake is no different.
This 808 acres of area, located in Hosakote Taluk, Bengaluru Rural district, is a significant water body ringed with a variety of habitats such as marsh, grassland and shrubs. If you are one of those bird enthusiasts then chances of coming across of the name "Hoskote lake" (the name changed to Hosakote) are pretty high. A person who is walking or jogging in the morning on the road that connects to Shri Abhaya Anjaneya temple will be greeted with songs from abundant avian friends such as sunbirds and in the midst of theirs you can hear tunes from Red-whiskered bulbuls. Jungle Mynas adding a bit of harmony. Then silent chirping from various species of warblers. And of course, the ubiquitous Tailor bird, whose company is almost guaranteed for anyone who strolls on that road. As you move your eyes slightly above you can find swallows perched closely to each other on the electric wires and occasionally Green-Bee eaters too mainly in the winters. While you continue to walk on the road, you can listen to Red-wattled Lapwing screeching distantly as it flies over vegetation. As the sunlight shines brighter. a glance at the sparkling water of the lake the first thing that catches anyone's attention is the wake, the trailing line follows when a Coot or a Duck swims. By the way, drama continuous in the water as well with Cormorants taking a dip and surprise you every time when they come out at a distance and direction that is hardly predictable. Occasionally they pop-up with a fish. It is not unusual to witness this kind of drama everyday, because why not? Around 266 distinct species of birds (according to the data from eBird) had considered this lake and its surroundings as their home either permanently or for a shorter period of time when they migrate from long distances. Two-sixty-six, with that number on her heart, the lake smiles and proudly tells you about the diversity of birds found here.
Wetland habitat specialists such as Purple Heron (Ardea purpurea), Egrets (Little [Egretta garzetta], Intermediate [Ardea intermedia], Great [Ardea alba] and Cattle [Bubulcus ibis]), Cormorants (Indian [Phalacrocorax fuscicollis], Little [Microcarbo niger], Great [Phalacrocorax carbo]), Black-headed Ibis (Threskiornis melanocephalus) are some of them which are found throughout the year in this wetland.
Northern Shoveler (Spatula clypeata), Northern Pintail (Anas acuta), Black-tailed gotwit (Limosa limosa), Bluethroat(Luscinia svecica), Western Marsh Harrier (Circus aeruginosus) etc. are some of the gorgeous guests who choose to make this area as their home during their winter migration almost every year.
The above image represents basics of the Carbon cycle.
Soil Health Check-up
For microbes to decide how much carbon to retain in the soil, there are several factors beyond Photosynthesis and the amount of organic matter present on the soil play a significant role. And hence it is an utmost important responsibility on us to measure how these factors are playing in keeping the wetland alive. For instance, are microbes comfortable with the temperature within the soil? If its too hot then they will breathe out the carbon quickly and if its too cold then they do not process much carbon. What is the alkalinity levels of the soil? Because microbes need an environment which neither too alkaline nor too acidic. Bacteria prefers from neutral to alkaline while fungi may thrive in acidic soils. Does the soil have enough moisture levels for the microbes to thrive? This has to be a little bit higher. Moisture in the soil plays a key role as it directly affects photosynthesis, soil respiration, microbial activity, and soil organic matter dynamics. If there isn't adequate moisture in the soil then it effects photosynthesis which in turn affects the health of the microbes since the inputs for them such as root exudates and litter, gets effected. As a result, microbes function less efficient in decomposing these materials into organic biomass. Excessive moisture can create anaerobic conditions (lack of oxygen) in the soil which results in increased amount of Methane (CH4) releasing into the atmosphere by microbes. Hence maintaining optimum levels is important controling emissions of Methane (CH4) and Nitrous oxide (N2O)
When all these factors are at optimum levels microbes convert carbon into their own biomass efficiently. To quantify how well the conversion happens is measured we use a metric called Carbon Use Efficiency. Once the conversion happens, we can measure the carbon stored in the soil and the potential rate at which the carbon is stored in the soil of a geographic area via Atlas SOC (Soil Organic Carbon) and Relative Sequestration rate potential respectively.
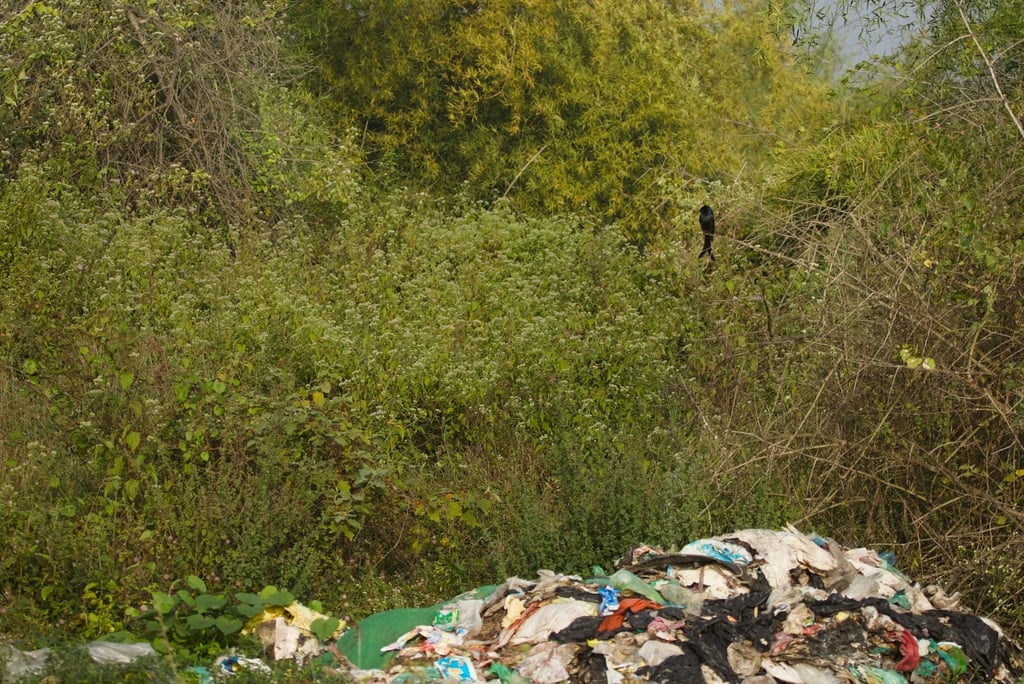
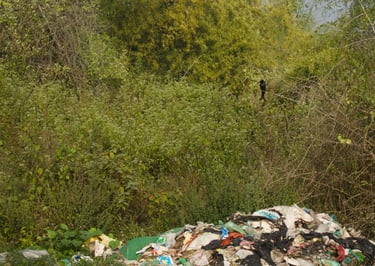
A Black Drongo perched on a twig. Beneath a pile of garbage thrown. This unfortunately is a common sight at this lake.